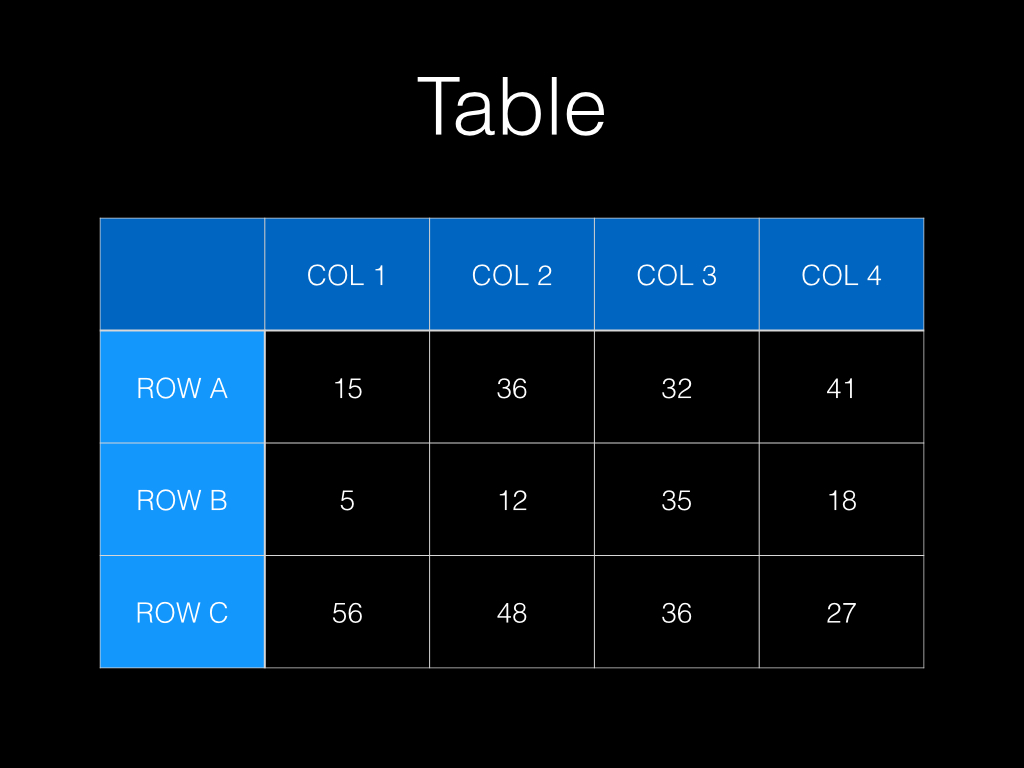
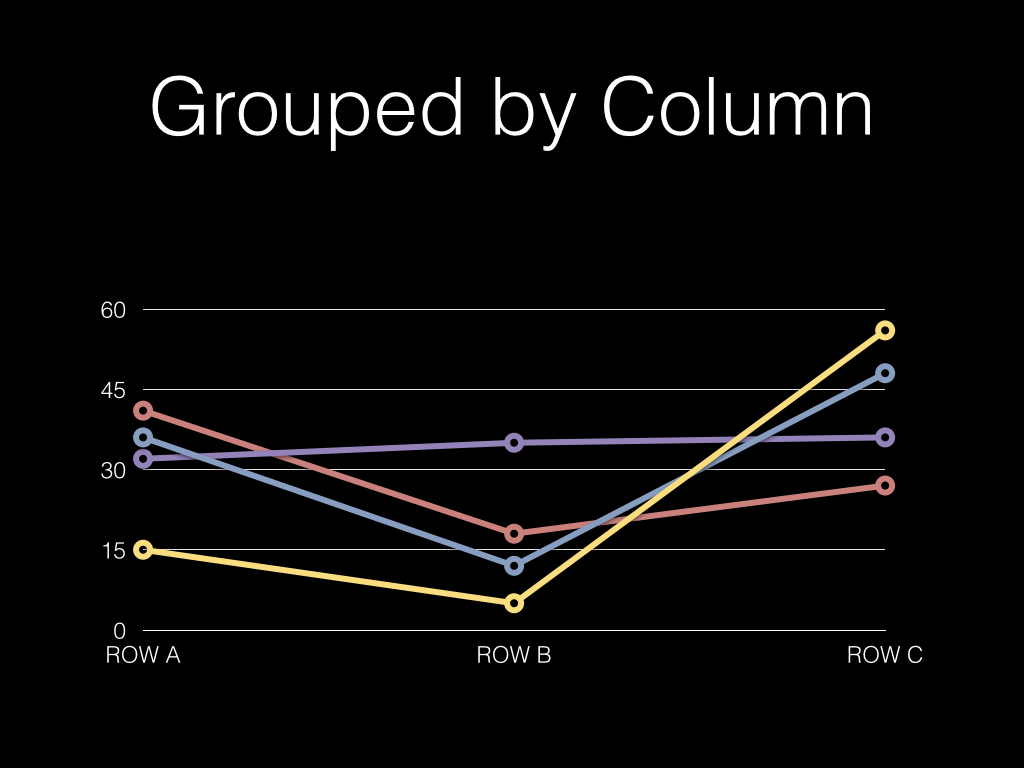
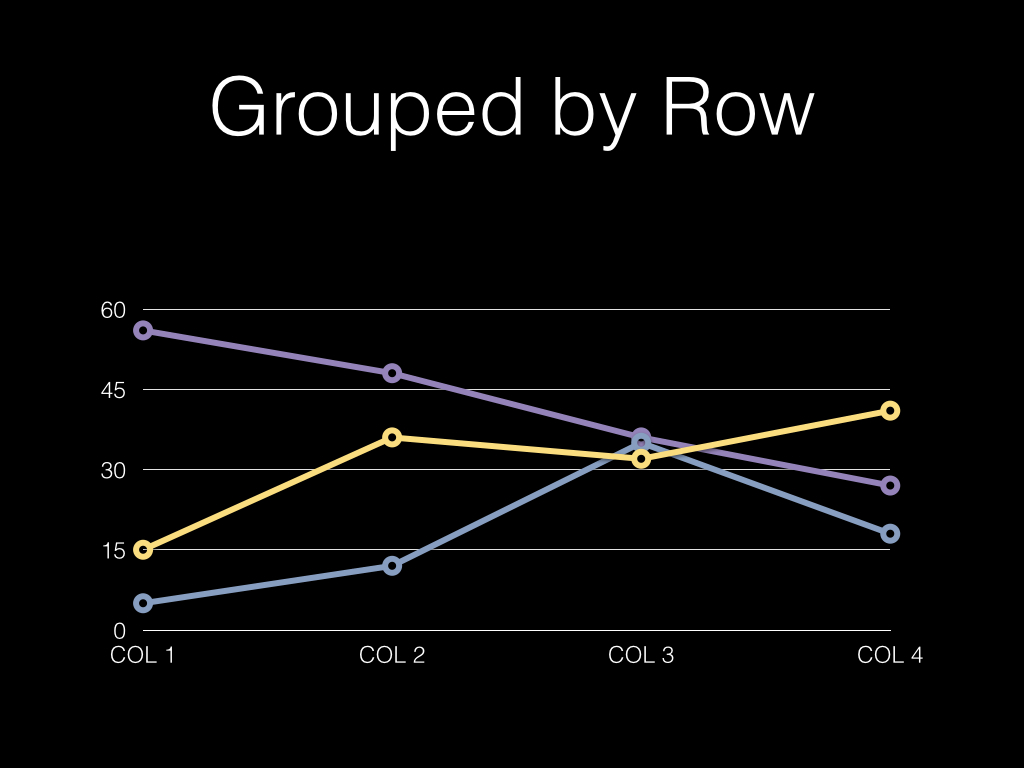
A compelling reason for using automation is its ability to quickly display data in a variety of formats. For example, a single data set can be displayed as a table, or as a chart, or as both — in seconds. With the AppleScript support in Keynote, connecting data to display becomes a hands-free process, as demonstrated by the following script that generates a presentation containing slides showing a table and multiple charts from a single data set: (⬇ see below )
Mention of third-party websites and products is for informational purposes only and constitutes neither an endorsement nor a recommendation. MACOSXAUTOMATION.COM assumes no responsibility with regard to the selection, performance or use of information or products found at third-party websites. MACOSXAUTOMATION.COM provides this only as a convenience to our users. MACOSXAUTOMATION.COM has not tested the information found on these sites and makes no representations regarding its accuracy or reliability. There are risks inherent in the use of any information or products found on the Internet, and MACOSXAUTOMATION.COM assumes no responsibility in this regard. Please understand that a third-party site is independent from MACOSXAUTOMATION.COM and that MACOSXAUTOMATION.COM has no control over the content on that website. Please contact the vendor for additional information.