The chart class is an element of the iWork Suite shared by all the iWork applications. Its current dictionary entry has no elements and no properties, and does not support the use of the make command.
The iWork Suite chart Class
chart
To add charts to Keynote documents, scripts can use the add chart command from the Keynote 2009 Compatibility Suite:
The Compatibility Suite add chart Command
add chart v : Add a chart to a slide.
add chart slide : The slide to add the chart to.
[ column names ( list ) ] : A list of text strings that are the names of the data columns.
[ data ( list ) ] : A list of data lists. The number of data lists must match the number of items in the row names, and the number of items in each data list, must match the number of items in the column names. Ex: {{23, 56, 2, 13}, {67, 22, 86, 53}} = 2 rows containing 4 columns of data.
[ group by ( chart row/chart column ) ] : The organizational method used to display the data.
[ row names ( list ) ] : A list of text strings that are the names of the data rows.
[ type ( pie_2d / vertical_bar_2d / stacked_vertical_bar_2d / horizontal_bar_2d / stacked_horizontal_bar_2d / pie_3d / vertical_bar_3d / stacked_vertical_bar_3d / horizontal_bar_3d / stacked_horizontal_bar_3d / area_2d / stacked_area_2d / line_2d / line_3d / area_3d / stacked_area_3d / scatterplot_2d ) ] : The type of chart to create. (include underscore characters)
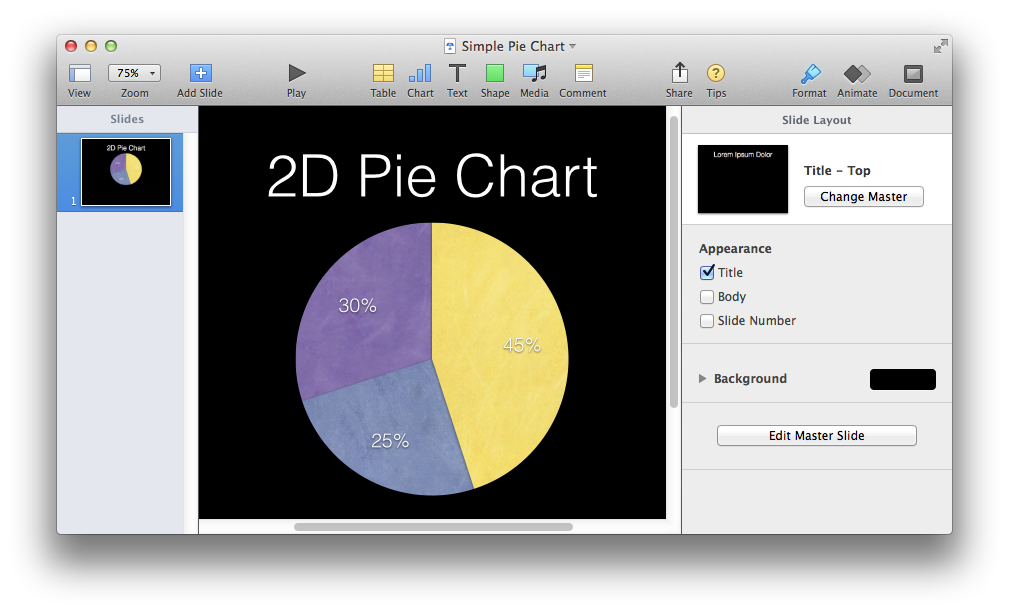
Pie charts are one of the most commonly used chart types, since their creation incorporates the use of a single data set, as in this example: